Posting on behalf of the ProbeLab Team and mainly @kasteph who carried out this study.
Introduction
The ProbeLab team has recently developed Akai, a generic libp2p DHT item sampler, which can be used to perform data availability sampling. To showcase the functionality of the tool, we use Akai to find out details about the relationship between CIDs and providers in the IPFS network. Akai is useful for content providers to check up on the availability of their content published on IPFS. To use Akai, you can clone it from the GitHub repository, build it, and simply run
akai find providers <cid>
to find the existing providers of a CID. Alternatively, you can run an Akai daemon, using akai daemon so that it may continue sampling over time.
Monitoring provider records helps assess data availability across the IPFS network and determine whether specific CIDs/content are at risk of becoming unavailable. This analysis is useful for evaluating the robustness of IPFS and how effectively IPFS achieves decentralization.
Experiment Setup
We deployed akai in the AWS us-east-1 region. The choice of CIDs used for this study was made based on assumed traffic popularity. The websites are:
multiformats.io:bafybeif4fyqju4oz7dsvv2b3tkb5nzuitbmp55kbeympjntcgnjqnrmu7qcid.ipfs.tech:bafybeihtnpesmy237bknra4t6o3hb7wht5trshj672wsa53wqditowwwqyhelia.io:QmYhSq292fe2wN9qxoFiyvofjv6WF7gvNoK6kSwm9RHVZp
The CIDs of the websites were found by using dig, a DNS lookup utility that is readily available in many UNIX machines. The exact command used was dig +short TXT _dnslink.<website>. Akai was deployed over a period of a week from the 13th to the 20th of June 2025.
Results
Provider Stability
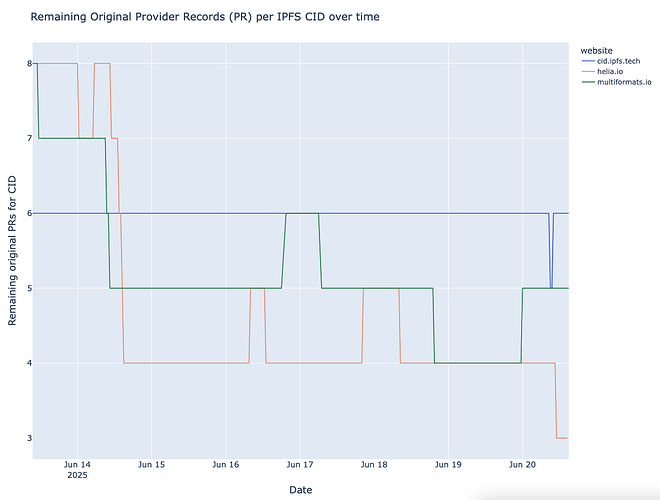
The plot below shows the provider record churn, or, in other words, the change in the number of original provider records over time for the tracked CIDs. In short:
- we first resolve the above websites to their CIDs,
- check how many providers claim to host the website, and,
- then monitor how many of these remain reachable over time.
The graph above shows that there is a general downward trend of remaining original providers. This is expected as peers churn over time. Similarly, a website redeployment during the measurement period may also decrease the number of providers, as that website’s previous CID will have become stale. Note that the y-axis does not reach zero, hence even after one week there are at least three peers claiming to host the website. The tail suggests a core set of stable and persistent providers. cid.ipfs.tech, maintains a consistent count of original provider records throughout the measurement period.
Total Providers
Looking at the remaining original providers over time only gives a partial view on the actual availability of a CID/content. For example, all the original providers may have churned hence the above graph would go down to zero, but they could have been replaced by new peers that have recently joined the network, requested the CID and fetched the content. As long as there is one peer hosting the content, the content is available in the network.
The active provider record count shows the number of peers currently providing each CID, indicating real-time availability.
cid.ipfs.tech and multiformats.io have a comparable provider counts (6-11 providers). However, the former has a more stable set of providers, maintaining a consistent count of 6 original provider records. helia.io fluctuates at 4-8 providers. helia.io shows the most volatile pattern with drops to 4 providers. This could suggest potential performance issues during low-activity periods and fewer IPFS clients claiming to be providers for a short time. The fluctuations could represent providers ceasing to host specific content due to reduced demand or providers leaving and joining the network.
Conclusion
From this brief study, we can observe that while cid.ipfs.tech and multiformats.io have similar provider counts, the former’s provider record stability is higher. The constant rotation of multiformat.io ’s and helia.io’s providers creates noise in the system, as clients may attempt to fetch content from peers that no longer possess it. helia.io exhibits the highest volatility, with provider counts dropping to as low as 4 during certain periods. This pattern suggests potential availability risks during low-activity periods, where the network becomes overly dependent on a small set of original providers, creating bottlenecks and single points of failure.
Get in touch
Please share feedback in this post, or feel free to reach out to the ProbeLab team through these contact details, if you require more clarifications. If you’re interested in tracking the availability of your content, please get in touch to talk through the details.

